The last update of Windows Azure (from June 2012) brought to us a lot new features. From virtual machines that can run Linux without any problem to distributed cache that can be store in-memory or on a dedicate machine.
One new feature that can help us after we deploy a product for Windows Azure is the ability to monitor and track resources utilization in real-time. Until now, when we wanted to monitor the resources that are consumed on Windows Azure we had to redirect all the Diagnostics Monitor data to Windows Azure tables or blobs. After all this data were written in the data store we need tools to be able to be able to interpret this information. For this, a lot of free tools exist, but they don’t work all the time as we expected. Each time when they information were loaded a lot of data is passed between Windows Azure and us – this means extra cost.
With the new version of Windows Azure, we have this mechanism build in. From the portal we can monitor and track the resources utilization in real time. We don’t need to search tools to view data and generate report. All this things are done by the portal for us.
In the moment when we create a new cloud service the minimal monitoring is provided to us. This means that we have the following metrics by default:
In our service definition of our role we will need to import the diagnostics module.
By default, if we set the level of diagnostic monitor to verbose, the data aggregation will be made at the following time interval: 5 minutes, 1 hour and 12 hours. All information older than 10 days is deleted automatically. The information is transferred from role instances at 3 minutes time interval.
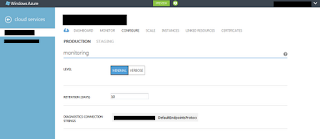
If we have all this configurations made on our instances, we can access any time the portal and change the configuration. For each cloud service we can go to the “CONFIGURE” panel and change the monitoring settings. We can only change the level of monitoring, the retention time interval (how many days data are stored before they are purged) and the connection string to the data store. A different configuration can be made for the production and staging environment. All this configurations can be done from the configuration file before deploying the solution to the cloud. Any configuration that is made on cloud services will not be persist if we make a new deploy on a new service instance.
A nice feature of the monitoring dashboard from Windows Azure is the ability to add any kind of metric. This feature is very useful when we try to debug a cloud service and we realize that we need to monitor some metrics. In that moment we can access the monitor dashboard and add the metrics that we need.
 Let’s see how this data is stored in Azure tables. For each role instance per aggregation time interval a different table is created. The naming format of each table at the first look can be pretty odd, but after we understand the format we will not have any problem to be able to understand it.
WAD[deploymentId]PT[aggregationInterval][R|RI]Table
where:
The easiest thing to do is to see the monitoring metrics report that is displayed in the monitoring panel. I don’t think that someone will have problems using and understating this information.
 In this post we saw how easy is to use the monitoring features from Windows Azure. With the new version of Windows Azure not only the configuration of diagnostics monitoring is simple but also reading all this data is very easily. On the top of this all this diagnostics configuration can be changed at runtime without any problem.
One new feature that can help us after we deploy a product for Windows Azure is the ability to monitor and track resources utilization in real-time. Until now, when we wanted to monitor the resources that are consumed on Windows Azure we had to redirect all the Diagnostics Monitor data to Windows Azure tables or blobs. After all this data were written in the data store we need tools to be able to be able to interpret this information. For this, a lot of free tools exist, but they don’t work all the time as we expected. Each time when they information were loaded a lot of data is passed between Windows Azure and us – this means extra cost.
With the new version of Windows Azure, we have this mechanism build in. From the portal we can monitor and track the resources utilization in real time. We don’t need to search tools to view data and generate report. All this things are done by the portal for us.
In the moment when we create a new cloud service the minimal monitoring is provided to us. This means that we have the following metrics by default:
- CPU Percentage
- Data In
- Data Out
- Disk Read Throughput
- Disk Write Throughput
In our service definition of our role we will need to import the diagnostics module.
<?xml version="1.0" encoding="utf-8"?>
<ServiceDefinition name=”FooService" xmlns="http://schemas.microsoft.com/ServiceHosting/2008/10/ServiceDefinition">
<WebRole name="FooWebRole">
<Imports>
  <Import moduleName="Diagnostics" />
</Imports>
</WebRole>
</ServiceDefinition>
<?xml version="1.0" encoding="utf-8"?>
<ServiceConfiguration serviceName="FooService" xmlns="http://schemas.microsoft.com/ServiceHosting/2008/10/ServiceConfiguration" osFamily="1" osVersion="*">
<Role name="FooWebRole">
<Instances count="2" />
<ConfigurationSettings>
<Setting name="Microsoft.WindowsAzure.Plugins.Diagnostics.ConnectionString"
value="DefaultEndpointsProtocol=h ttps;AccountName=AccountName;AccountKey=AccountKey"/>
</ConfigurationSettings>
</Role>
</ServiceConfiguration>
By default, if we set the level of diagnostic monitor to verbose, the data aggregation will be made at the following time interval: 5 minutes, 1 hour and 12 hours. All information older than 10 days is deleted automatically. The information is transferred from role instances at 3 minutes time interval.
If we have all this configurations made on our instances, we can access any time the portal and change the configuration. For each cloud service we can go to the “CONFIGURE” panel and change the monitoring settings. We can only change the level of monitoring, the retention time interval (how many days data are stored before they are purged) and the connection string to the data store. A different configuration can be made for the production and staging environment. All this configurations can be done from the configuration file before deploying the solution to the cloud. Any configuration that is made on cloud services will not be persist if we make a new deploy on a new service instance.

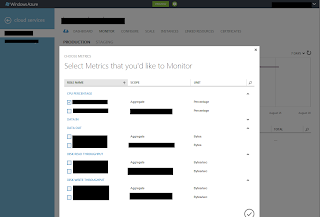
A nice feature of the monitoring dashboard from Windows Azure is the ability to add any kind of metric. This feature is very useful when we try to debug a cloud service and we realize that we need to monitor some metrics. In that moment we can access the monitor dashboard and add the metrics that we need.
 Let’s see how this data is stored in Azure tables. For each role instance per aggregation time interval a different table is created. The naming format of each table at the first look can be pretty odd, but after we understand the format we will not have any problem to be able to understand it.
WAD[deploymentId]PT[aggregationInterval][R|RI]Table
where:
- WAD – this is the default suffix that is added to the table name
- deploymentId – id of the deployment
- PT – characters used for delimitation
- aggregationInterval – aggregation interval (the values can be: 5M, 1H, 12H)
- R|RI – aggregation type (it can be at role level aggregation – R, or aggregation for role instances – RI)
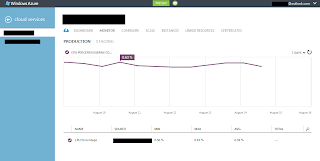
The easiest thing to do is to see the monitoring metrics report that is displayed in the monitoring panel. I don’t think that someone will have problems using and understating this information.
 In this post we saw how easy is to use the monitoring features from Windows Azure. With the new version of Windows Azure not only the configuration of diagnostics monitoring is simple but also reading all this data is very easily. On the top of this all this diagnostics configuration can be changed at runtime without any problem.
Comments
Post a Comment