Caching is one of the most common solutions used to increase the performance of an application and to protect the databases from throttling and intensive queries. In this article, we analyze if a standard cache solution is our best option all the time.
Context
We are working on a web application with a frontend and an API consumed by the front-end and other 3rd parties systems. We don’t have control on the 3rd parties, but every 2 months, the number of request increase with 200%.
The current solution build by the team is written in .NET Core and runs inside Azure App Services. In-memory caching is used for content that is often retrieved from the database (Azure SQL DB).
New Gen
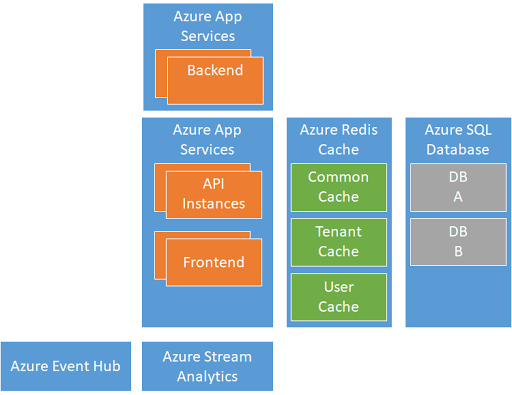
The number of Azure App Services Instances increased, and to protect the database and backend, the team decides to disable stick session (session affinity) and migrate to a distributed cache solution.
The team decides to use Azure Redis Cache and to split the cached content into 3 different cache repositories:
- The Common Cache used to cache content that is not tenant or user-specific
- The Tenant Cache used to cache tenant-specific content
- The User Cache is used to cache user-specific content per session. This content is all the time encrypted.
The solution is implemented in 2 weeks of work, and in 6 weeks, it goes into production. It is a big success; the average response time decreased by 30% and the load on the database and backend decrease drastically.
Team no. 2
In parallel with our team, another team is working on adding new functionality that enables users to see real-time the current status of devices in all the factories around the globe (1.5M devices). The status of each device is updated every 2s.
Because on the roadmap, the Tenant Cache was already planned, they decide to use also the cache to store the state of the devices.
BOOM!
The integration goes well, and all performance tests are a big success. Once they go into production, the response time of Azure Redis Cache increase from a few ms to 10–15s. All the read and write operations to the cache are slow.
The cluster size of Azure Redis Cache is increased, but the running costs too high for the business, and the real-time monitoring feature of devices is disabled.
What happened?
Azure Redis Cache is amazing and works great as long as you use it for high number of read operations and a low number of write operations. By updating every 2s the state of each device, the load of the tenant cache increased with 750k write operations per second. Even if the load is distributed over multiple regions around the globe, the number of write operations was over 150k per region.
The performance tests that were run before going live weren't able to increase the write/update load on Azure Redis Cache enough to be able to detect this problem.
Solution
By design, it does not make sense to update the state of a device if remains the same. Taking this into account, the state of devices is stored inside Azure Redis Cache, but updated only when is changed.
In normal conditions, the state of a device changes every 4–16h only and in a timeframe of 1h a maximum of 20% of devices state is changed.
Even so, from the business point of view, the 2s heartbeat is essential and cannot be changed. For example to be pushed only when the device has a new state.
The redesign solution is collecting the device heartbeats into Azure Event Hub. The information is forwarded to Azure Stream Analytics that is configured in such a way to detect when the state of the device changed. When a new state is detected, an Azure Function is called that updates the value from Azure Redis Cache.
In this way, the solution is able to ingest a high number of notifications from devices and analyze in near-real-time and store the device state in a storage that is optimized for a high number of read operations.
Comments
Post a Comment