Take a look around you and tell me if you see at least one smart devices capable to send data. There are big chances that you'll have around you more than one. In this moment I have around me a laptop, a Surface, my Fitbit, a SmartTV and a Raspberry PI that fully equipped with weather sensors.
You might say who cares about the data that are collected from them. Maybe nobody or just adds companies. If you would be on a production lines things would be different, you would like to be able to visualize this data from different perspective, analyze them and find way the production fluctuated in a specific day.
Timebound
Data that is collected from different sensors and devices can contain a lot of parameters like temperature, humidity, light and noise level. But in the end when we want to visualize this data, the time information will be the one that will be used on a chart to look at data.
Try to imagine a chart where you put only temperature and humidity information, excluding the time sample. It would look odd and only in some narrow cases it would be useful.
 In the end, almost all the data is visualized from devices is bound to time information. I would even say that without time this data is useless and can be used only in some isolated situations.
Current systems
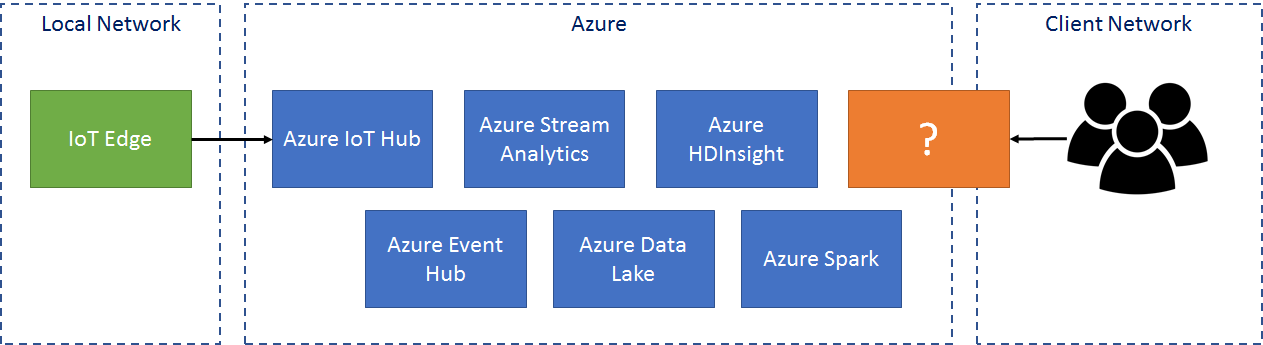
The market already showed to us that an out of the box solution that can be used:
Powerful systems like Azure IoT Hub, Azure Event Hub and gateway/device application were developed to collect and move data from devices to backend. Stream Analytics, together with Azure HDInsight and Azure Spark are doing such a great job on the backend to cruck each piece of data and Azure Data Lake is the bucket where to can push all the data that is collected.
But when you want to look over the data and search inside it things don't look so good. On the market there are some powerful products like Power BI or ElasticSearch that can improve our life, but they are not specific for what we want to do and see.

When we want to visualize data collected from devices we want to:
Ingress rates and capacities
There are multiple different capacity rates that are supported by this service. Starting from 1M events per day to 100M events per day. 100M events per day means that you can look and investigate near real time reports that ingest more than 1157 events per second.
For now, the current capacity of Azure Time Series Insights enable us to store for 30 days all the data. This is more than enough for a monitoring system used by a technician that offers support 24/7.
REST API
The nice UI that comes with Azure Time Series Insights is backed-up by a REST API that allows us to do all the actions that we can do from UI. This can be useful when we want reporting data and throw them on a client specific dashboard.
The full query API can be found on Microsoft documentation, together with a good C# sample.
Conclusion
There is no need all the time to create our own reporting system. Even if it is appealing to start use system likes Azure HDInsights we need to be aware that this kind of system will not be able to provide us near real-time information. Additional to this it can be costly to have clusters for this purpose.
Services like Azure Time Series Insights are extremely useful when we need to have monitoring dashboard of the devices that are on the field, together with their status and behaviour. The most powerful feature of a service like this is the ability support real-time queries on near real-time data from a simple dashboard that can be used by the technician that is on the field without the support of IT department.
You might say who cares about the data that are collected from them. Maybe nobody or just adds companies. If you would be on a production lines things would be different, you would like to be able to visualize this data from different perspective, analyze them and find way the production fluctuated in a specific day.
Timebound
Data that is collected from different sensors and devices can contain a lot of parameters like temperature, humidity, light and noise level. But in the end when we want to visualize this data, the time information will be the one that will be used on a chart to look at data.
Try to imagine a chart where you put only temperature and humidity information, excluding the time sample. It would look odd and only in some narrow cases it would be useful.
Current systems
The market already showed to us that an out of the box solution that can be used:
- On device to collect data
- Over the internet to transmit information
- On the backend to process and visualize data
Powerful systems like Azure IoT Hub, Azure Event Hub and gateway/device application were developed to collect and move data from devices to backend. Stream Analytics, together with Azure HDInsight and Azure Spark are doing such a great job on the backend to cruck each piece of data and Azure Data Lake is the bucket where to can push all the data that is collected.
But when you want to look over the data and search inside it things don't look so good. On the market there are some powerful products like Power BI or ElasticSearch that can improve our life, but they are not specific for what we want to do and see.
When we want to visualize data collected from devices we want to:
- Look at data from time perspective
- Navigate and correlate data without having to write queries
- Fast response
- Don't care about storage, processing power or indexing
This can be achieved using the services mentioned before plus some extra work and care. But wouldn't be nicer to have an out of the box solution where we just push data without caring about anything else?
Azure Time Series Insights
Azure Time Series Insights it is a full managed analytics storage and visualization service offered as an out of the box service. It allows us to explore collected metrics from our device in a near real time manner. The biggest difference between this service and other solutions that are on the market stays is the way how this service works.
This services is not only a web wrapper over other services. It contains the end-to-end solution required to analyze data from storage - analytics+queries capabilities together with a powerful and flexible user interface.
Once data are fetch inside Azure Time Series Insights, they are stored internally. We don't need to care about availability of the storage or how many cores we need to be able to execute a query on top of our data.
As the name of the service says, it is focused on data visualization around timestamp. In most of the cases on 0x axis we will have the timestamp information, allowing us to drill down into the collected data. Data can be grouped, filtered, explored in any way, without having to think about indexing or waiting an index to be updated.
This kind of service helps us to do root cause analytics and to monitor our devices in near real time. Even if we have a powerful REST API, the specialist that use this service doesn't need to write any line of code.
Near real-time
For such a system it is important to define what does near real-time means, otherwise each of us could understand a different thing by this term. For Azure Time Series Insights near-real time mean that once the data is ingested, the data is available for queries in maximum 60 seconds.


For example if the rate of a mechanism engine drops from 10.000 to 7.000 pierces we will be able to see this on our dashboard in 60 seconds.
Queries capabilities
From query capabilities the features available are similar to the one that we have on SQL queries. This combined with a intuitive user interface, the user can construct a query easily without having to write the query by himself.
Additional to charts the heatmap it is useful when we want to spot deviation or strange behaviors. From heat map we can spot in a few second a deviation from the normal metrics and drill down inside it.


Drilling down is done with only one click using the zoom capabilities. We just need to select the a specific time segment and we can look insight it.
Of course each chart can be saved and reused. The dashboard allows us to customize it based on our needs.
Event Source
In this moment Azure Time Series Insights has support to ingest data from Azure Event Hub and Azure IoT Hub using an event broker. This is enough for most of the IoT use cases that are now on the market.
Even if in the future other sources will be supported like Azure Data Lake, I don't expect to be used heavily because Azure Time Series Insights is design for near real-time monitoring, when you looked at data that was produced in the last few hours/days.
When you want to consolidate data collected from different sources, combining them in different ways, than Azure Data Lake combined with Azure HDInsight, Azure Spark or Power BI might become your best friends.
Data Format
The data format that can be processed by this system is JSON. This is compatible with data in transit that can be found in Azure Event Hub and Azure IoT Hub. The future might bring other formats to be supported - like XML.
From JSON capabilities, there is support not only for simple JSON, but also nested ones that contains multiple objects, arrays or event events with two JSON object. There is a nice feature of Azure Time Series Insights that allows it to transform a JSON event with two objects into two different events.
[
    {
        "deviceId":"rvrsbpi",
        "deviceTimestamp":"2017-06-06T11:12:03Z",
  "temp":"21.0"
    },
    {
        "deviceId":"rvrsbpi",
        "deviceTimestamp":"2017-06-06T11:12:04Z",
  "temp":"21.2"
    }
]
Ingress rates and capacities
There are multiple different capacity rates that are supported by this service. Starting from 1M events per day to 100M events per day. 100M events per day means that you can look and investigate near real time reports that ingest more than 1157 events per second.
For now, the current capacity of Azure Time Series Insights enable us to store for 30 days all the data. This is more than enough for a monitoring system used by a technician that offers support 24/7.
REST API
The nice UI that comes with Azure Time Series Insights is backed-up by a REST API that allows us to do all the actions that we can do from UI. This can be useful when we want reporting data and throw them on a client specific dashboard.
The full query API can be found on Microsoft documentation, together with a good C# sample.
Conclusion
There is no need all the time to create our own reporting system. Even if it is appealing to start use system likes Azure HDInsights we need to be aware that this kind of system will not be able to provide us near real-time information. Additional to this it can be costly to have clusters for this purpose.
Services like Azure Time Series Insights are extremely useful when we need to have monitoring dashboard of the devices that are on the field, together with their status and behaviour. The most powerful feature of a service like this is the ability support real-time queries on near real-time data from a simple dashboard that can be used by the technician that is on the field without the support of IT department.
Comments
Post a Comment